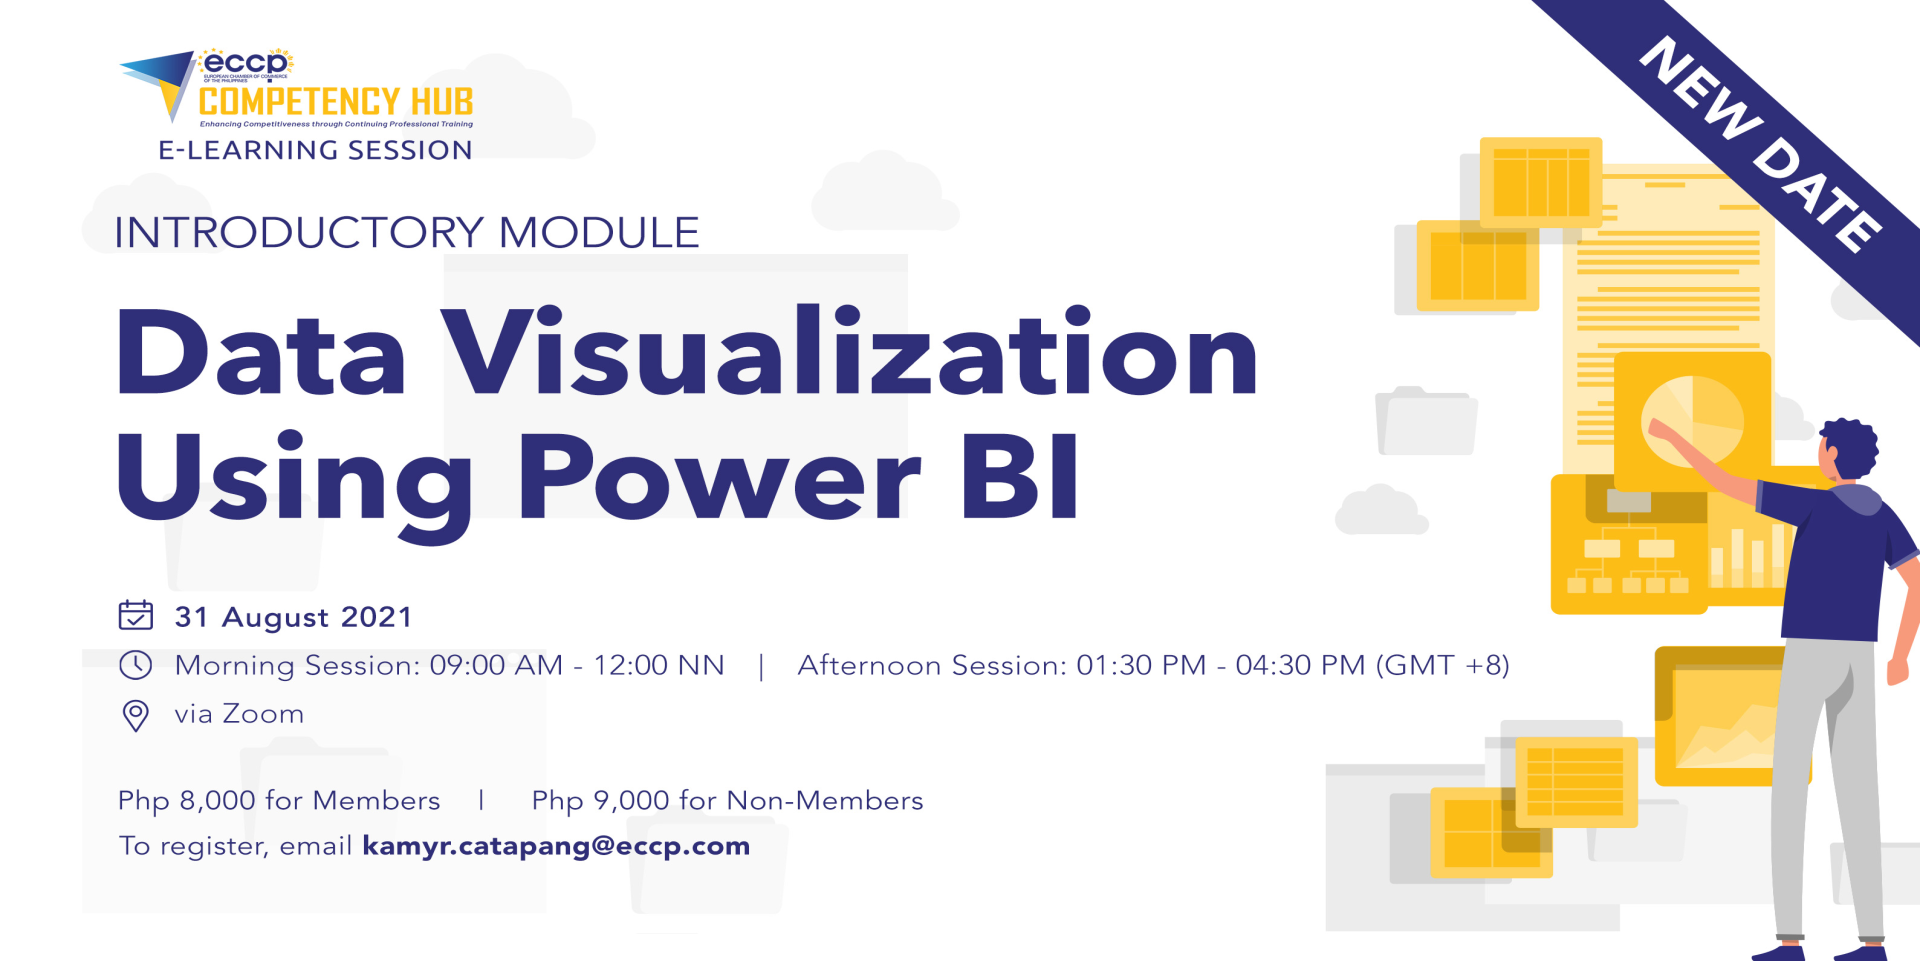
Data Visualization using Power BI: Introductory Module
Learn how to analyze and display data using Power BI and make better, more data-driven decisions!
Power BI is a collection of software services that work together to turn unrelated sources of data into coherent, visual, and interactive insights. IN other words, it is a visualization and analytics tool for business intelligence. In this 6-hour introductory module, attendees in this program will be able to (a) connect information; (b) visualize data; (c) create better charts and graphs; and (d) create immersive dashboards which will help address of professionals to sort, compare, and analyze data in an efficient and timely manner.
This is a good learning opportunity to improve your intelligence skills in business! Businesses today consider it indispensable for data-science-related work, so don't miss out!
Program Outline:
MS POWER BI Introduction
Topics include:
- Introduction to Power BI
- Power BI environment
- Power BI Desktop
- Power BI Service Online
- Power BI Gateways
- Power Pivot
- Power Query
- Power View
- Power Map


